
Stop Chasing Likes: The Metrics That Actually Grow Your Business in 2025
1. Introduction: Why Measurement Is Broken in Digital Marketing
Digital marketing is more sophisticated than ever in 2025—yet many brands still measure success in the same way they did ten years ago.
Likes. Impressions. Views. Follower counts.
They're simple to track, but are they actually growing your business? The brutal truth: Most brands are optimizing for the wrong metrics.
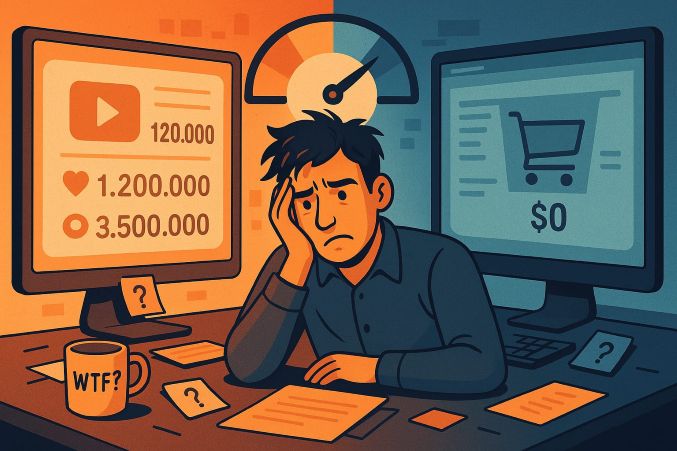
Social media platforms and digital ad networks thrive on engagement, so they incentivize marketers to chase vanity metrics. But what happens when a post gets 10,000 likes but zero sales? Or when a viral video boosts brand awareness but doesn’t convert?
The problem isn’t just misaligned KPIs—it’s a fundamental misunderstanding of what drives real business value.
In this guide, we’ll explore why traditional digital marketing measurement is broken, the dangers of vanity metrics, and the real KPIs that will grow your business in 2025 and beyond.
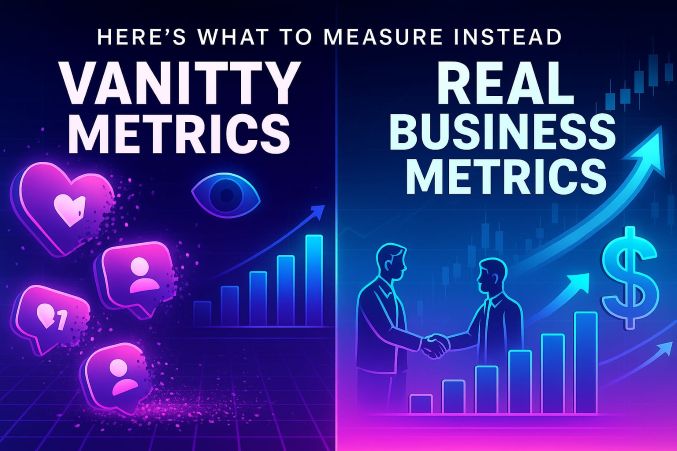
2. What Are Vanity Metrics (and Why They're Dangerous)
Definition of Vanity Metrics
Vanity metrics are data points that look impressive but don’t correlate with business success. Examples include:
Likes, shares, and comments (unless tied to conversions)
Impressions and reach (if they don't translate to engagement or sales)
Follower number (if followers aren't active customers)
Page views (without looking at bounce rate or time spent)
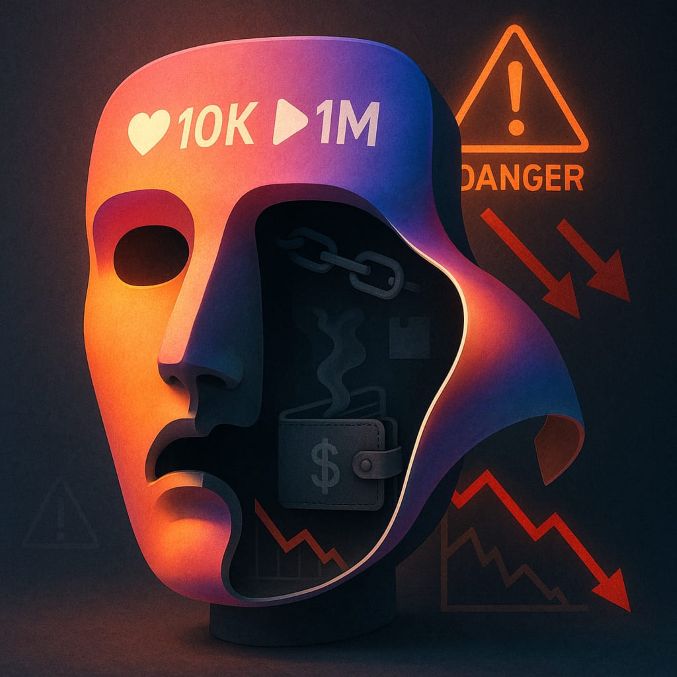
Why They're Hazardous
They Give False Confidence – A large number of likes can make you feel successful, but if those likes don't translate into sales, then they're worthless.
They Mislead Strategy – If you optimize for engagement rather than revenue, you'll attract the wrong crowd.
They Waste Budget – Ad spend that gets likes but not sales is an inefficient return on investment.
They Ignore Long-Term Value – A viral post may create a spike in traffic, but if that traffic doesn't come back, the effect will be fleeting.
Example: A company spends $10,000 on a viral TikTok campaign that receives 1M views but makes only 10 sales. Was it worth the money?
3. The Shift Toward Ethical and Performance-Based Measurement
Consumers in 2025 are wiser than ever before. They penetrate shallow engagement strategies and expect genuine value from brands.
What Is Ethical Marketing Measurement?
Transparency – Honesty regarding what data is being measured and for what reasons.
Value-Driven – Measuring what actually drives customer satisfaction and revenue.
Long-Term Focus – Focusing on customer retention rather than one-off conversions.
Why It Matters
Builds Trust – Customers reward brands that honor their data and provide genuine value.
Boosts ROI – Ethical tracking makes sure that marketing investment drives real business results.
Future-Proofs Your Strategy – Platforms are shutting down artificial engagement and manipulative behavior.
Example: Rather than investing in bots, a brand invests in high-intent leads that have the highest chance of converting into repeat customers.

4. Actual KPIs That Matter in 2025 and Beyond
If not likes and impressions, what do you measure? Here are the metrics that actually grow your business:
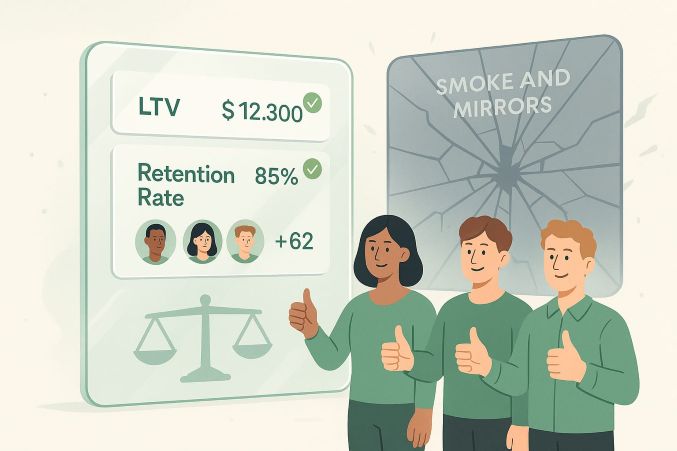
1. LTV (Lifetime Value)
What it measures: The overall revenue a customer produces during his lifetime with your company.
Why it matters: Greater LTV implies greater profitability and deserves greater acquisition costs.
2. CAC (Customer Acquisition Cost)
What it measures: Cost per pay customer acquired.
Why it matters: If CAC is greater than LTV, your business model is not sustainable.
3. Retention Rate
What it measures: The proportion of customers that return after their initial purchase.
Why it matters: Raising retention by only 5% can increase profits between 25-95% (Bain & Co.).
4. Quality of Engagement (Not Quantity Alone)
What it measures: Significant interactions (e.g., replies, saves, repeat visits).
Why it matters: A small active audience is more valuable than a large inactive one.
5. Conversion Rate
What it measures: Percentage of users who perform a wanted action (buy, sign-up, etc.).
Why it matters: Good conversions indicate your marketing is successfully influencing decisions.
6. Net Promoter Score (NPS)
What it measures: Customer satisfaction and willingness to recommend your brand.
Why it matters: Satisfied customers turn into brand ambassadors, driving down CAC.
5. The Link Between Measurement, Trust, and Revenue
How Ethical Tracking Builds Trust
Customers are more likely to make purchases from brands they trust.
Transparency in data practice enhances brand reputation.
Ethical marketing yields greater customer satisfaction and retention.
How Trust Maps to Revenue
Greater LTV: Brands that are trusted hold on to customers for longer.
Lower CAC: Word-of-mouth lowers acquisition expenses.
Greater Brand Equity: Trusted brands have the luxury of charging premium rates.
Case example: Patagonia's commitment to sustainability and ethical business has created a loyal customer base happy to pay a premium for its wares.
6. Brands Doing It Right: Case Studies and Best Practices (Expanded)
1. Patagonia – The Gold Standard in Customer Lifetime Value
Metric Mastery: Rather than fixating on quarterly sales flurries, Patagonia measures 10-year customer value by monitoring its "Worn Wear" program, repairs, and lifetime warranties.
Strategic Insight: By fostering product longevity, they've built a self-sustaining customer group where 75% of new purchasers return in 18 months.
Data Point: NPS of 82 (compared to apparel industry average of 40) shows ethical practices have a direct effect on loyalty.
2. Buffer – The Transparent Growth Engine
Radical Openness: Buffer shares actual-time dashboards displaying CAC payback period (now 5 months compared to 8 months in 2023) and churn.
Psychological Payoff: Transparency has decreased refund requests by 22%—customers trust brands with nothing to hide.
Lesson: When you're no longer hiding behind vanity metrics, you get more valuable customers who value authentic brands.
3. Indian D2C Revolution – Profit-First Metrics
The Mamaearth Playbook: Measuring repeat purchase velocity (45% of revenue is from buyers who buy 3+ times a year), they've maximized inventory and ad spend.
The Man Company's Secret: Their subscription business has a 4.2:1 LTV:CAC ratio—every ₹1 they spend in ads returns ₹4.20 over 24 months.
Key Trend: Such brands leverage WhatsApp commerce to measure conversation-to-conversion rates, demonstrating owned channels beat social media.
4. Tesla's Zero-Ad CAC Model
Contrarian Metric: $0 spend on traditional ads, yet 2.1 million annual car deliveries. How?
They Measure:
Referral Conversion Rates (18% of sales through owner referrals)
Test Drive-to-Order Ratio (32% conversion at dealerships)
Implication: When the product-market fit is ideal, your customers serve as salespeople.
7. How to Audit Your Current Metrics (Advanced Framework)
Phase 1: The Vanity Metric Purge
Red Flag Checklist:
Are you reporting "potential reach" rather than trackable conversions?
Are your "engagement rates" polluted with bot traffic? (Clean using tools such as SparkToro)
Is your boardroom still debating follower numbers? (Time for an intervention)
Phase 2: The Funnel Remapping Exercise
For E-commerce:
Old Metric: "Add-to-carts"
New Metric: "Cart-to-cashier time" (Shortening this from 5 mins to 90 secs boosted Zivame's conversions by 27%)
For SaaS:
Dump "free trial sign-ups"
Monitor "Day 7 activation rate" (Users who take 3+ key actions)
Phase 3: The Profitability Stress Test
CAC Truth Serum:
Your total ad spend
Deduct influencer gifting expenses (amazing how many neglect this)
Divide by paying customers (not leads)
LTV Reality Check:
Are you accounting for returns/refunds?
Have you added in support costs? (High-touch customers can wipe out margins)
Phase 4: The Dashboard Detox
Keep:
Real-time LTV:CAC ratio
Cohort-based retention heatmaps
Support ticket sentiment analysis
Delete:
"Social share of voice"
"Estimated impressions"
Any measure with the phrase "viral" in it
8. Ethical Snares to Steer Clear of in Tracking Performance (Deep Dive)
1. The Dark Side of AI Maximization
Issue: Algorithms maximizing for "engagement" now amplify rage-bait and disinformation.
Brand Risk: Research found "outrage content" is 3x shared but drops purchase consideration by 41%.
Solution: Take a close look at what your "top performing" content actually says about your brand.
2. The Attribution Illusion
Last-Click Fraud: 68% of credit is given to final touchpoints, overlooking:
Podcast mentions built trust
Retail store experiences
18-month nurture sequences
Advanced Fix:
Use time-decay attribution
Measure assisted conversions in GA4
3. The Silent Killer – Metric Myopia
Example: AB testing button colors without considering that 63% of cart abandonments occur because of surprising shipping fees.
Diagnosis Tool: Perform a "Metric Impact Hierarchy" analysis:
Tier 1: Revenue-per-user
Tier 2: Retention drivers
Tier 3: Engagement proxies
4. The Vanity Benchmark Trap
False Comfort: "Our 2% conversion rate is industry standard!"
Reality: Industry leading performers in your market are at 5.8% (see ProfitWell benchmarks)
Action: Substitute comparative metrics with aspirational benchmarks
9. Tools and Dashboards for Monitoring What Matters (2025 Edition)
The Anti-Vanity Stack
Tool\tHidden Gem Feature\tPro Tip
Baremetrics\tMonitors "Revenue per employee" to optimize bootstrapped efficiency\tLink to Stripe for instant SaaS health
Winn.ai\tLogs sales calls to review "objection-to-close" ratios\tSynchs with HubSpot for deal stage analysis
VWO
Heatmaps scroll depth on 10,000-word blog articles
Found 72% of readers skip to pricing tables
Gong
Measures "customer silence duration" during meetings
Alerts when prospects tune out
Chameleon
Tracks in-app microsurveys ("Why did you cancel?")
3-question surveys receive 83% response rates
The CEO's Only Dashboard
Single Screen:
Cash runway for today
90-day LTV forecast ahead
Support ticket alert spikes
Data Source: Grafana-built with Snowflake backend
10. Conclusion: From Likes to Loyalty — The Future of Marketing Measurement (Expanded Vision)
The 2025 Measurement Manifesto
Vanity Metrics Are Violence – They waste company lifespan. The average startup has 18 months of runway—don’t burn it tracking illusions.
Ethics Are The New SEO – Google now ranks brands using EEAT (Experience, Expertise, Authoritativeness, Trustworthiness). Your metrics must prove all four.
Predictive Analytics Or Perish – Tools like Causal and Mutiny now forecast LTV 18 months out. If you’re not modeling future value, you’re guessing.
Comments
No Comments To Display